
Please wait as map loads.
More: Special section: Zika virus
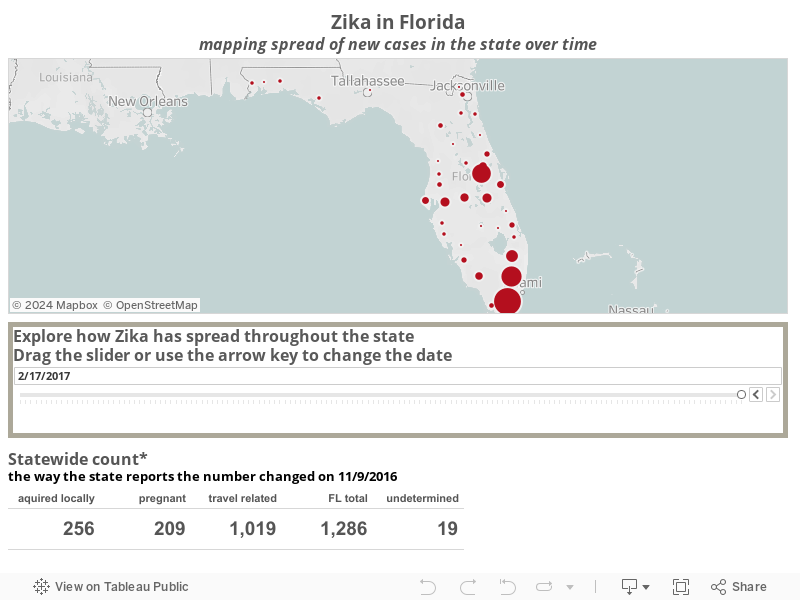
With the growing number of travel-related Zika virus cases in Florida, we are tracking them to keep you informed.
The Florida Department of Health is issuing an update each weekday around 2 p.m. and our map will be updated to reflect any changes in the number of cases.
The map shows the total number of cases for each county. The blue circles indicate there are locally acquired cases of the Zika virus in that county.
The chart below the map tracks the total number of statewide cases as well as the number of pregnant women infected with the virus.
Mouse over the graph or the map and you will see details: the date, the number of confirmed cases and the number of cases that were acquired locally.
Use the slider or the arrow key above to change the date, the map and graph will change accordingly.
