More than 7 percent of children aged 6-17 used prescribed medications for emotional or behavioral difficulties, a 2014 nationwide study by the Centers for Disease Control found.
This means that in a typical Florida classroom you’d expect on average one or two children to be medicated.
The Contact 5 investigators were intrigued by this number and wanted to learn more.
We requested a list of medications administered at schools in the past 5 years from the Palm Beach County Healthcare District, which runs the school nurses program.
Note that this information offers just a glimpse into the subject matter, as not all medications are taken at school and not all medications taken at school are administered by school nurses.
Furthermore, the information shows only the number of medications administered, it does not show how many children were administered the medications nor does it break down the age, gender of recipients of these medications.
We took the list of more than 200 medications that the Healthcare District provided and with help of an expert identified several dozen ADHD medications.
Next we calculated for each of the schools how many medications they administered and how many of these were ADHD medications.
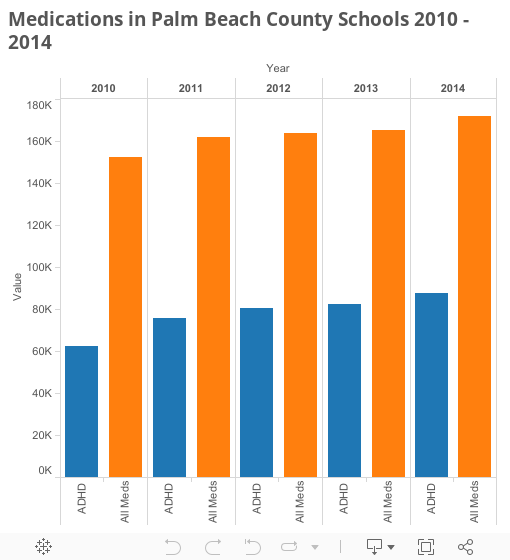
For the district as a whole the number of medications that are administered has increased year over year.
During the same period the number of ADHD medications administered rose faster and now makes up more than 50 percent of all medications given to students in school.
Some schools more than others
There’s great variation between schools in how much medications are administered, from several dozen at some schools to several thousand pills each year at other schools in the district.
The numbers fluctuate from year to year but appear to be relatively consistent within the same school, meaning that schools that administered relatively few medications in one year tended to do the same in other years.
When we focus on ADHD medications we see a similar pattern; greater variation among schools than within the same school over the years.
Within the scientific community it is well documented that children in families living below the poverty level have a higher use of prescribed medication for emotional or behavioral difficulties.
Given that our data are on the school level we cannot make inferences to the level of the individual children because we don’t know how many students are the recipients of these medications in schools, and hence we do not know who these students are let alone whether or not they qualified for free or reduced lunch.
Our data set gives us information regarding medications administered by nurses in the schools.
This is a limited universe because we do not know what medications are taken without the help of school nurses in or outside of the school.
Having said that, we did tentatively explore the relationship between poverty and use of ADHD medications in schools.
We determined for each of the schools the percentage of students eligible for free and reduced price lunch and looked at the relationship to the number of ADHD medications administered at the school.
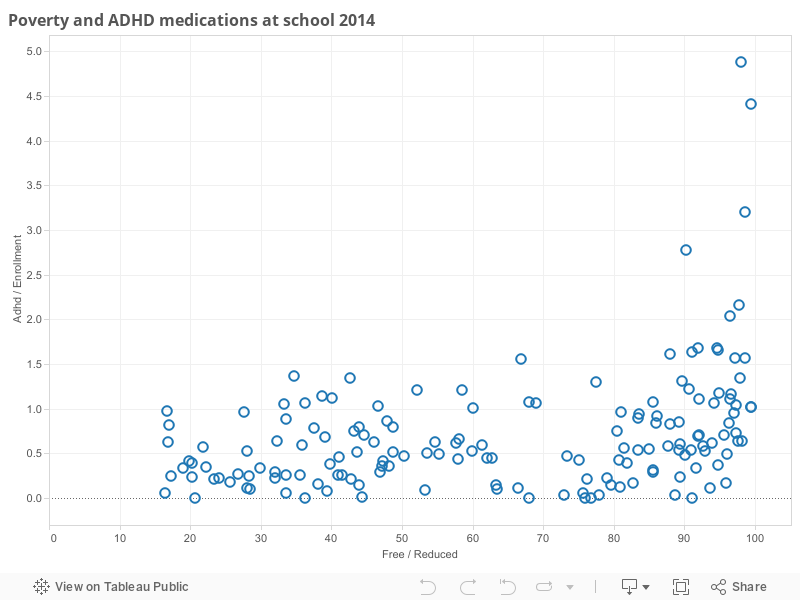
What the scatter plot shows is in line with our expectation that schools with a higher percentage of children eligible for free and reduced price lunch tend to administer more ADHD medications per student.
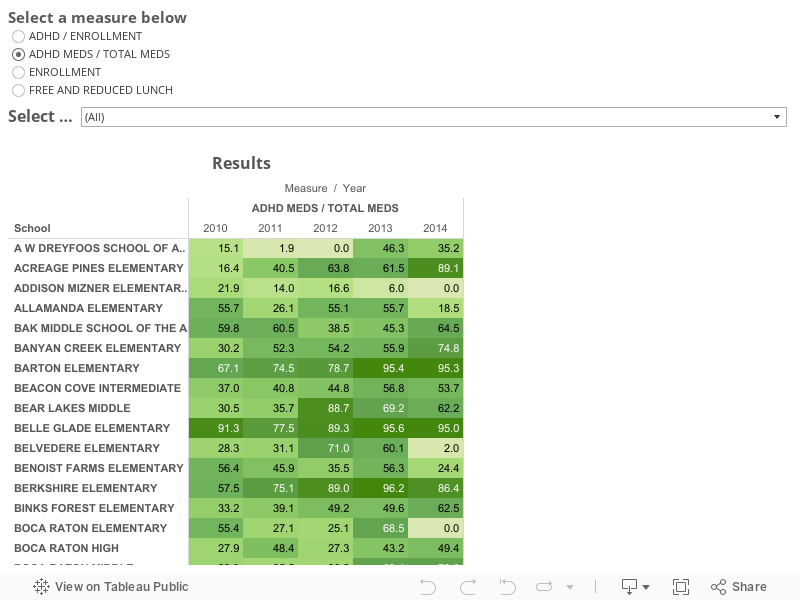
We have put all of the data in an interactive graphic for you to explore.
You can look up and compare the school(s) of your choice for the 5 year period (2010 – 2014)
We have several measures you can compare the schools on, see below to find out what these measures mean.
ENROLLMENT: The total number of students enrolled at the school.
FREE AND REDUCED LUNCH: The percentage of students at the school eligible for free or reduced price lunch.
TOTAL MEDS: The total number of times medications were administered.
ADHD / TOTAL MEDS: The percentage of all medications administered at the school that are ADHD medications.
ADHD / ENROLLMENT: The number of ADHD medications administered per student. We took the number of ADHD medications administered at the school and divided it by the number of students. The number can be as low as 0, if none of the students at the school was administered ADHD medications. The number can be as high as there are days in the school year (180), if every child at the school is administered an ADHD pill every day of the year.