

It's no secret that thieves prefer to prey on those that make themselves easy targets.
Are you doing enough to make sure you don't fall victim to criminals?
WPTV looked at a troubling trend that just won't go away.
Car break-ins are among the most common crimes, and often we find out that the owner left the car unlocked.
Leaving your car unlocked can lead to items being stolen out of your car and that can ruin your day, but WPTV found a spike in area vehicle thefts, which means vehicles that were outright stolen.
More than half of our area agencies saw an uptick in motor vehicle thefts from 2014 to 2015.
Among agencies that saw an increase is West Palm Beach, where thefts of motor vehicles went up by 351 from 2014 to 2015 and the Indian River County Sheriff's Office that reported a nearly 70 percent increase in stolen cars.
A recent report on vehicle thefts shows that a region, that includes most of Palm Beach County, ranks in the top five for cars that were stolen with the keys left inside.
That's right, keys left inside the vehicle. Can you believe this, every six an a half minutes in this country, a car is stolen with the keys or a key fob left inside.
Those drivers didn't exactly make it hard for the criminals, did they? Give yourself the best chance. Almost every story we report in our morning show on this topic brings the same advice from police.
Move your valuables out of sight and lock your doors. It seems obvious, but many don't follow this advice.
As part of a program called Uniform Crime Reporting, each year area law enforcement agencies report the number of certain crimes to the Florida Department of Law Enforcement and the Federal Bureau of Investigations.
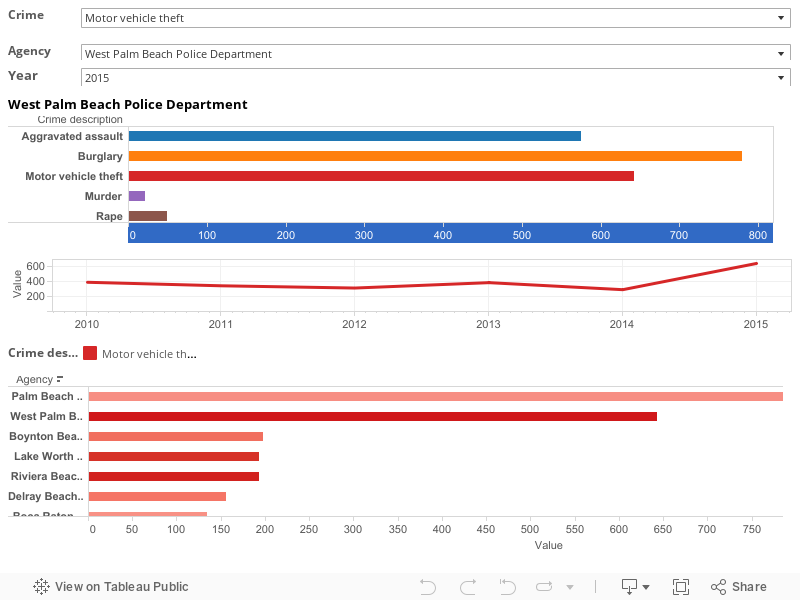
Check out our crime interactive
The interactive below lets you compare area agencies, and look at the number of crimes as well as the crime rates the agencies have reported to the FBI since 2010.
Select an agency, select a crime and a year and the graphics will adjust.
As some agencies police larger populations, you'd expect to see more crimes. To correct for that, we calculated crime rates per 100,000.
The larger the bar, the more crimes were reported, the darker the color higher the rate of that certain crime.
Click here if the graphic doesn't display in full